Every investor in WaterfallOne has a dedicated detail page that gives you a complete picture of their position, from contributed capital to distribution history, broken down by waterfall tier. Whether you're answering an LP's question about their returns or pulling data for an audit, the investor page puts everything in one place.
Getting to an Investor Page
You can reach an investor's detail page from two places:
- Investors tab in the left sidebar. Shows all investors across all assets. Click any investor to see their full profile.
- Asset detail page: the investor positions table lists everyone on that asset. Click any row to jump to that investor's asset-specific page.
Overview Tab
KPI Summary Cards
At the top of every investor page, summary cards show the numbers that matter most:
- Contributed Capital: Total amount this investor has put into the asset, including initial contributions and any reinvestments.
- Total Received: Cumulative distributions paid to this investor across all finalized distributions.
- Equity Multiple: Total received divided by contributed capital. A quick measure of return performance.
- Unreturned Capital: How much of the investor's original contribution has not yet been returned. Once this hits zero, the investor has received full return of capital.
- Unpaid Pref: Preferred return that has accrued but not yet been paid. This card appears when there is outstanding unpaid preferred return for the investor.
These values update automatically as new distributions are finalized or capital events are recorded.
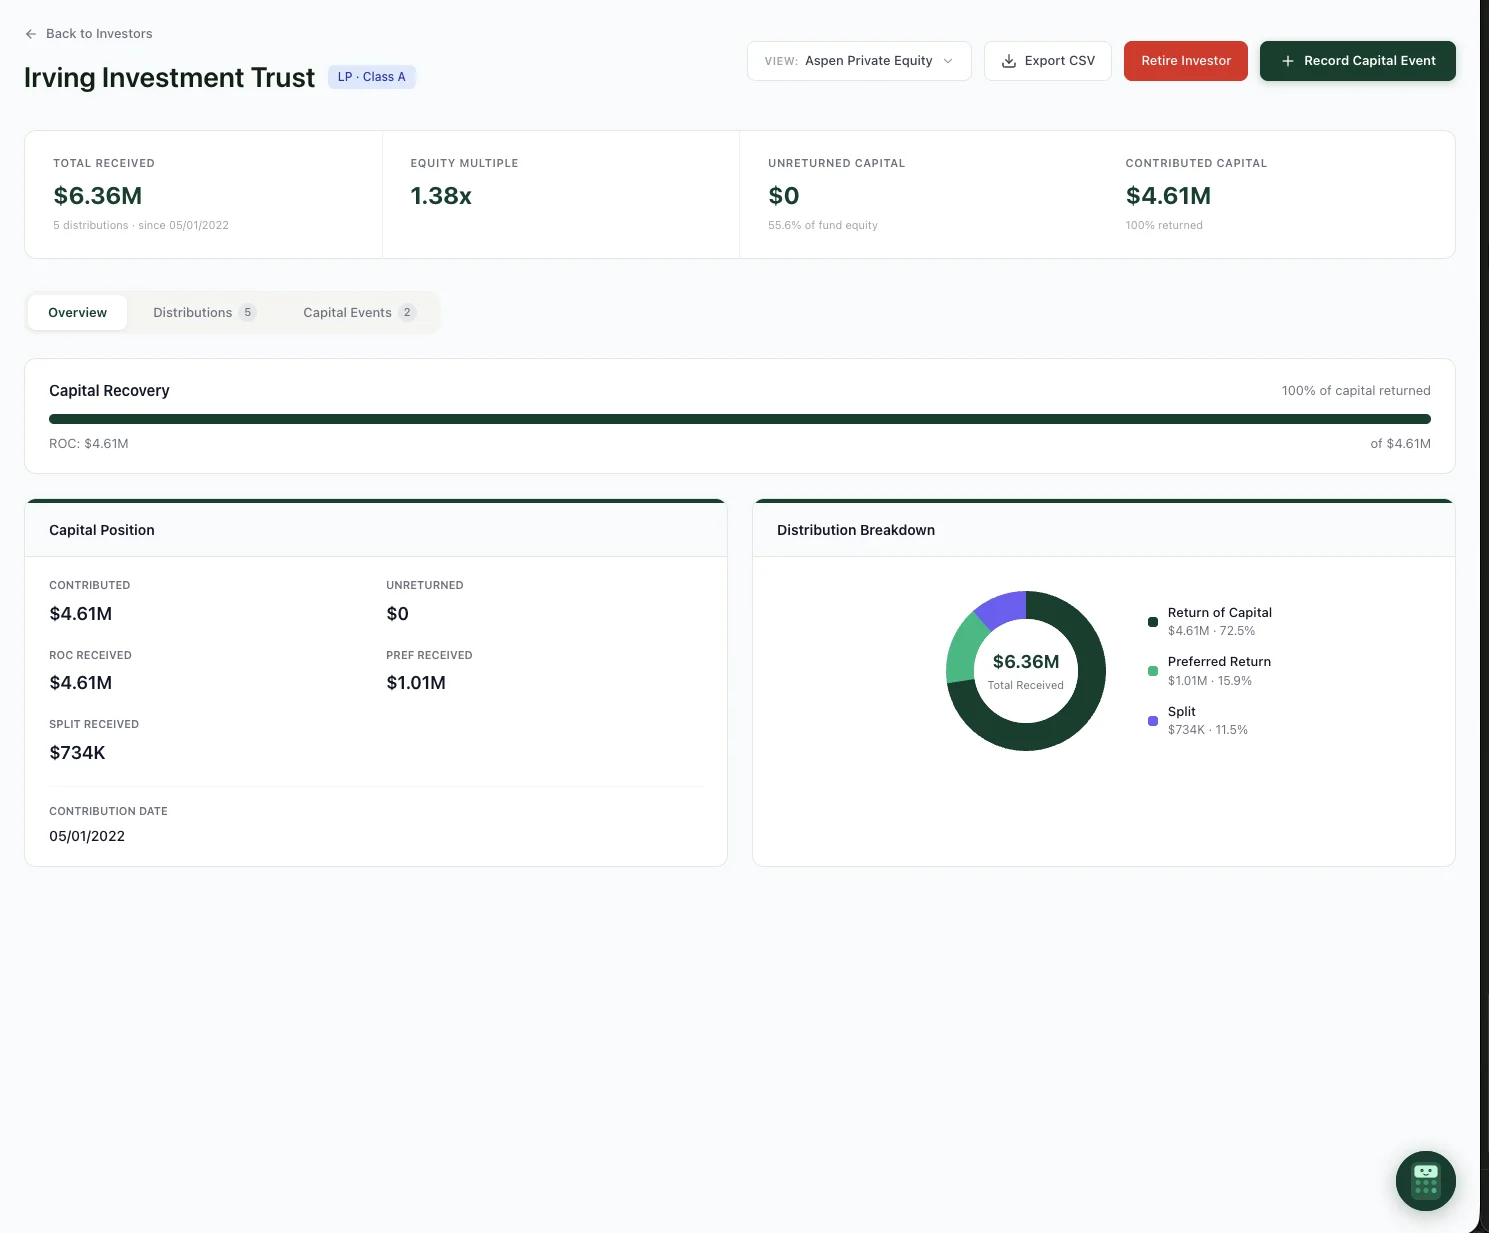
The investor overview. KPI cards, capital recovery progress, position details, and distribution breakdown at a glance.
If an investor participates in multiple assets, use the View filter at the top to switch between assets or see their combined position across your portfolio.
Distribution History Tab
The Distributions tab lists every finalized distribution this investor has received, with a column for each waterfall tier: Return of Capital, Preferred Return, Catch-up, and Promote. This lets you see not just how much was paid, but where each dollar came from in the waterfall.
You can filter distributions by type (Finalized, Test, Adjustment, or Voided) and sort by date or amount. Each row links to the full distribution record so you can drill into the complete allocation breakdown.
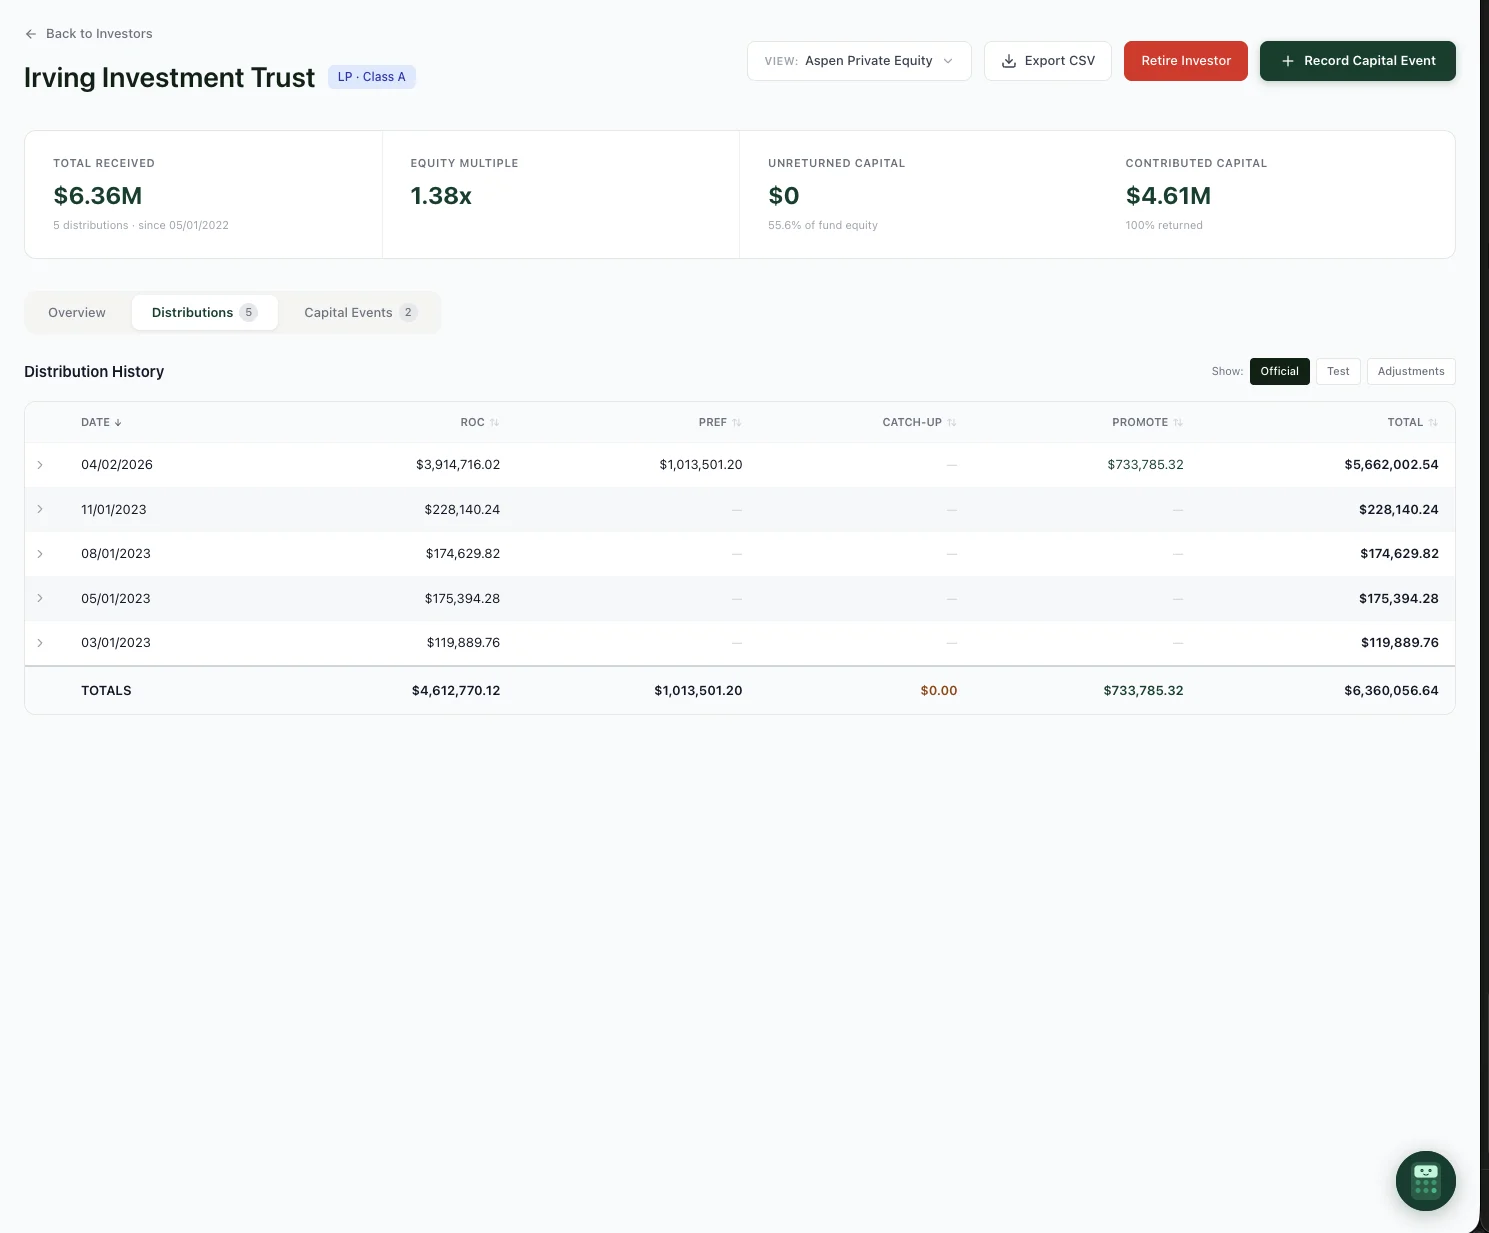
The Distributions tab. Every distribution broken down by waterfall tier with running totals.
Capital Events Tab
Capital events are the contributions, reinvestments, and adjustments that change an investor's capital position over time. The Capital Events tab shows a chronological log with the event type, amount, date, and who recorded it.
You can record new capital events directly from this tab by clicking the Record Capital Event button. Events are immediately reflected in the KPI cards above and in all future waterfall calculations.
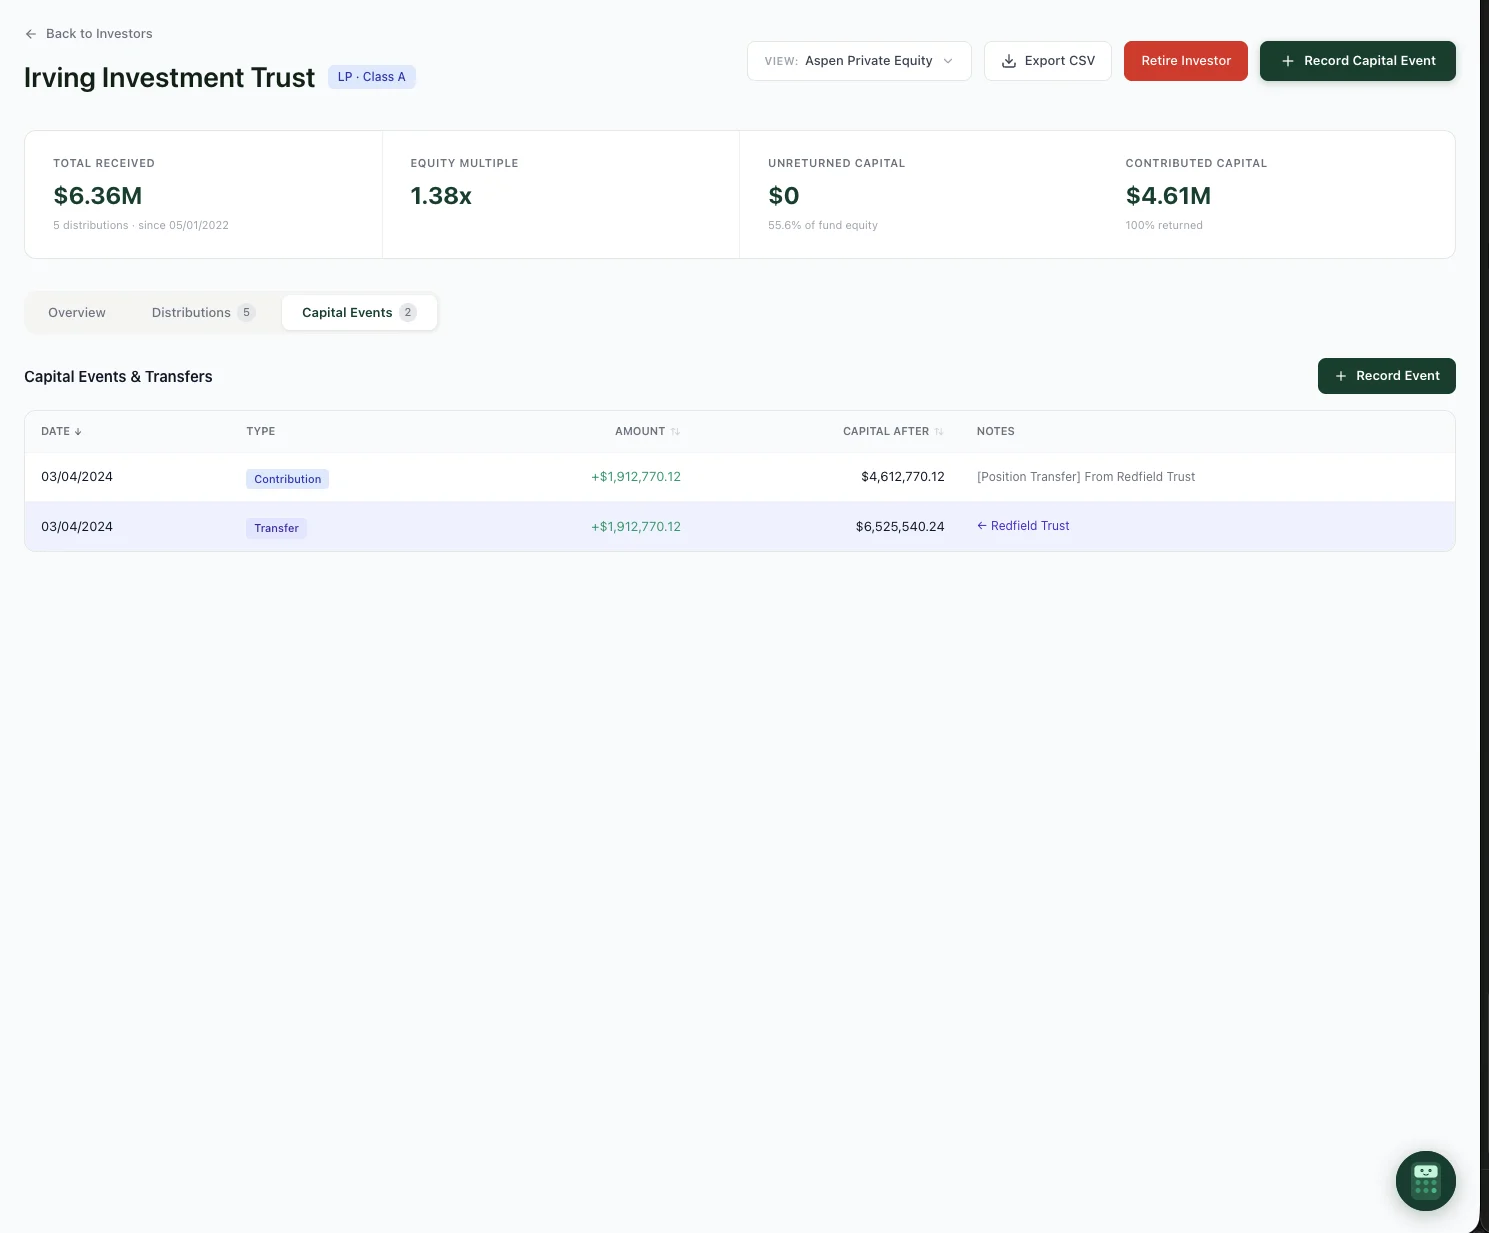
The Capital Events tab. View the full history of contributions, transfers, and corrections.
Cross-Asset View
If an investor participates in multiple assets, the dropdown filter at the top of the page lets you view cumulative performance across their entire portfolio with you. Total contributed capital, total distributions, and a blended equity multiple give you the full picture without switching between assets.
The same dropdown also lets you jump directly to the investor's page on any specific asset they participate in.
GP and Multi-Class Handling
Investor pages handle GP positions and multi-class structures correctly. If an investor holds a carry-only GP position, their page reflects that, showing promote distributions without return-of-capital or preferred tiers. Class designations (Class A, Class B, GP) are displayed throughout, so you always know which investor class you're looking at.
Exporting Investor Data
Every investor page includes a CSV export option. The export includes the full distribution history with tier-level detail, capital events, and summary metrics. This is useful for sending to investors, importing into your accounting system, or preparing audit documentation.
Ready to try it?
Start free. No credit card required.